


To enable fast and predictable lead times in any value stream, there is usually a relentless focus on creating a smooth and even flow of work …
—Gene Kim et al., The DevOps Handbook
Make Value Flow Without Interruptions
![]() Note: This article is part of Extended SAFe Guidance, and represents official SAFe content that cannot be accessed directly from the Big Picture.
Note: This article is part of Extended SAFe Guidance, and represents official SAFe content that cannot be accessed directly from the Big Picture.
This is the third of three extended guidance articles on Accelerating Flow with SAFe. It introduces SAFe’s eight flow accelerators and describes how they are applied in the value stream to increase throughput. The other two articles in the series—Accelerating Flow with SAFe and Value Stream Management in SAFe—describe the Lean-Agile principles and concepts that help establish a flow-based delivery culture.
Enterprises must respond quickly to market changes to remain competitive in the digital age. Delivering a continuous flow of value to customers in the ‘shortest sustainable lead time’ is the central theme of SAFe. Doing so requires moving new system features through the development value stream as quickly as possible. Achieving continuous flow requires a new way of working that eliminates the traditional start-stop-start project cycle and the waterfall phase gates that hinder flow.
The principles and practices that enable the uninterrupted flow of value in SAFe are integral to the Lean-Agile Mindset and ‘Lean Thinking’ [1], which can be summarized as:
- Precisely specify value by product
- Identify the value stream for each product
- Make value flow without interruptions
- Let the customer pull value from the producer
- Pursue perfection
The focus of this article is #3 above—how we make value flow without interruptions.
What is Flow?
First, it’s important to understand what SAFe means by flow. Flow occurs when there is a smooth, linear, and fast movement of work product from step to step in a relevant value stream. While the details of any flow system are based on its context, all flow systems have eight common properties, as illustrated in Figure 1.

Each is described briefly below:
- Queue. It all starts with a set of work items to be done. In addition, each value stream needs a prioritizing mechanism to sequence the work for the best value.
- Policies. Policies are integral to flow. They may be local policies, like team-based policies that determine how a work item moves from step to step, or global policies, like those that govern how work is performed within the company.
- Handoffs. Handoffs wouldn’t be necessary if one person could do all the work. But in any material flow system, different individuals and teams will have different skills and responsibilities. Each plays its part in moving a work item through the system.
- Feedback. Customer and stakeholder feedback is integral to efficient and effective outcomes. Ideally, feedback happens throughout the entire process.
- Bottlenecks. In every flow system, one or more bottlenecks limit the flow through the entire system.
- Worker. People do the important work in moving work items from one state to another.
- Work in process. There is always some work in process in the system; if there weren’t, there could be no flow of value.
- Batch. As any system has a finite capacity, not all the work can be done simultaneously. Therefore, work through the system occurs in batches designed to be as efficient as possible.
The Eight Flow Accelerators
Each flow property is subject to optimizations, and often many steps see unnecessary delays, bottlenecks, and other impediments to flow. Making value flow without interruptions can best be achieved by adopting the eight ‘flow accelerators’ described in this article. These powerful accelerators of value are relevant to all levels of the Framework.
#1 Visualize and Limit WIP
Overloading teams and ARTs with more work than can be reasonably accomplished is a common and pernicious problem. Too much work in process (WIP) confuses priorities, causes frequent context switching, and increases overhead. It overloads people, scatters focus on immediate tasks, reduces productivity and throughput, and increases wait times for new functionality. Like a highway at rush hour, there is simply no upside to having more work in a system than the system can handle.

The first corrective action is to make the current WIP visible to all stakeholders. Figure 2 shows a simple Kanban board that illustrates the total amount of WIP and the process state of each work item. This Kanban serves as an initial process diagnostic, showing the current bottlenecks. Often, simply visualizing the current volume of work is the wake-up call that causes the organization to address the systemic problems of too much work and too little flow.
The next action is balancing the amount of WIP against the available development capacity. This is done by establishing—and continually adjusting—WIP limits for the relevant states. No new work is done when any workflow state reaches its WIP limit. This matches demand to capacity and increases flow through the system.
Limiting WIP, however, requires knowledge, discipline, and commitment. It may even seem counterintuitive to those who believe that the more work you put into the system, the more you get out. That can be true up to a point, but when the system becomes overloaded, throughput decreases dramatically. Indeed, there is no substitute for effectively managing WIP.
#2 Address Bottlenecks
Bottlenecks are people or resources (systems, materials, and so on) in the flow of value whose demand is equal to or greater than the available capacity [2]. Examples include a shortage in a specialized skill (such as a data scientist), insufficient processing power for the build servers in the CI/CD pipeline, or a silicon supply shortage for building the integrated circuits of a cyber-physical system. Work piles up at a bottleneck and limits the effective throughput of value, as Figure 3 illustrates. Upstream processes are starved and waiting. In other words, bottlenecks cause a system to operate slowly and uneconomically, far below its potential capacity.

The best way to eliminate bottlenecks is to increase the process’s capacity by restructuring the workflow or adding more people or other resources at the bottleneck step. For the best economics, improvement efforts and investments should focus on addressing bottlenecks rather than optimizing upstream or downstream processes. They’ll have their turn later when the next issue appears.
Bottlenecks are not always easy to resolve. Fortunately, teams likely have other valuable stories in their backlog that do not require bottleneck resources. Selective replanning can increase value flow while the bottleneck is being addressed.
#3 Minimize Handoffs and Dependencies
Handoffs occur whenever there is a separation between knowledge, responsibility, action, and feedback [4]. For example, dependencies happen between teams when the work of one team cannot continue until related work by another team is completed (see Figure 4). Both result in development waste in the form of wait states in the flow of value. They can also lead to rework as the knowledge transfer is likely imperfect, causing further delays.

The best solution to overcome handoffs and dependencies is to create teams and ARTs with all the knowledge, resources, skills, and decision-making authority to create an end-to-end flow of value. However, unhealthy dependencies and handoffs can still occur even when teams and trains have all the skills to deliver end-to-end value. For example, a series of handoffs between Agile Team members or delays waiting on decisions to be made outside the ART. Activities like value stream mapping, retros, and the I&A problem-solving workshop can help identify the root causes and potential solutions.
#4 Get Faster Feedback
Learning is the foundation of improvement and the engine that powers product development [4]. Doing this as fast as possible speeds up and improves the overall development process. The goal is to get positive and negative feedback that can be immediately fed back into the development process as early as possible.
However, we often discover that getting early feedback can be difficult for a variety of reasons, for example:
- Lack of direct access to customers
- Delays in the development value stream
- Late or infrequent integration results in discovering hidden work and defects
- Building the wrong things or more functionality than what’s needed
Fast feedback is generally achieved by applying the basic Plan-Do-Check-Adjust (PDCA) learning cycle. However, to accelerate flow further, we’ve found that more needs to be done, for example:
- Applying customer centricity and design thinking as part of product development and engaging with customers frequently
- Making improvements to the continuous delivery pipeline, including build and test automation, test-first practices, and continuous integration
- Keeping work items small so they result in faster working increments of value
- Using built-in quality practices, mob work, pairing, and swarming to increase team cohesion and focus on finishing one backlog item at a time
- Upholding a solid definition of done (DoD) to help teams work together to finish increments of value and share knowledge
- ‘Stopping the line’ to fix problems when they occur
Generally, solution builders need two types of feedback from each PDCA cycle (Figure 5):

- Feedback about building the right thing. This feedback can only come from those users, customers, and economic stakeholders who can measure a solution’s actual value. Each PDCA cycle is an opportunity for this learning, from early mockups and storyboards to system demos held during development to feedback on pre-releases and deployed systems in production.
- Feedback about building it right. Innovative systems constantly push the bounds of the technology and the developers’ skills. Each PDCA cycle also evaluates if the right technology is applied to optimally solve the customer’s problem and meet the critical nonfunctional requirements (system ‘ilities”) that characterize robust and effective solutions.
Creating the mechanisms and processes to collect a wide range of data is the critical first step to promoting flow with faster feedback, but it doesn’t stop there. The information should be quickly analyzed and evaluated to make effective adjustments and initiate the next PDCA cycle based on these learnings.
#5 Work in Smaller Batches
Faster feedback is one of the primary reasons for working in smaller batches. The smaller the size, the faster teams can collect and evaluate the feedback to adjust. In addition, smaller batches reduce WIP by limiting the number of requirements, designs, code, tests, and other work items moving through the system at any point. Smaller batches go through the system faster and with less variability, fostering faster learning. Moreover, since each item in the batch has some variability, larger batches accumulate more variability.
The economically optimal batch size depends on the holding cost (the cost for delayed feedback, inventory decay, delayed value delivery, etc.) and the transaction cost (the cost of preparing and implementing the batch). Figure 6 illustrates the u-curve optimization for batch size [2].

To improve the economics of processing smaller batches— teams should focus on reducing the transaction costs—resulting in higher throughput. Reducing batch size typically involves investment in automating the Continuous Delivery Pipeline, including infrastructure and automation, continuous integration, builds, regression testing, and more. Use shorter iterations and PIs to reduce batch size.
#6 Reduce Queue Length
Another critical way to accelerate flow is to ‘shorten queues.’ As we have all experienced, long queues are fundamentally bad. They introduce waste, delays, and information decay. In addition, Little’s Law (Figure 7) informs us that the average wait time equals the average queue length divided by the average processing rate. (While this might sound complicated, even the line at Starbucks illustrates that.) Therefore, assuming any average processing rate, the longer the queue, the longer the wait.

For solution development, the longer the queue of committed work awaiting implementation, the longer the wait time for new features, regardless of the team’s efficiency. For example, suppose an ART has an average flow velocity of 10 features per quarter and a committed backlog of 30. In that case, they will have to wait three quarters before any new ones can begin development.
So, reducing the queue length is required for faster service and a more consistent flow of value. Reducing queue length decreases delays, reduces waste, increases flow, and improves predictability.
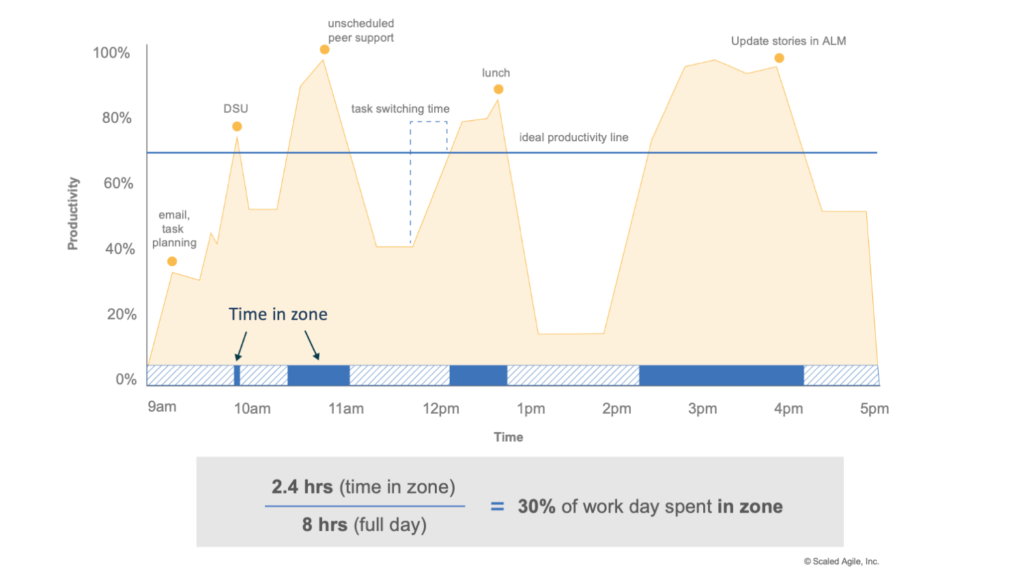
#7 Optimize Time ‘In the Zone’
Being ‘in the zone’ (also described as being in a ‘flow state’) is an engaged mental state of extreme focus on an activity where the work feels effortless and time passes quickly. People and teams in the zone demonstrate higher creativity, productivity, happiness, and personal fulfillment. Getting into this mental state requires uninterrupted focus time, autonomy, competence, and connectedness to others to engender self-actualization and intrinsic motivation. [5]
Contrast this to the conditions in a typical work environment where work occurs in functional siloes in a batch-queue-handoff system. There, frequent interruptions (emergency requests, ad hoc status reports, constant communication alerts, and so on) are the norm, and excessive WIP drives frequent task switching. (Figure 8).
There is an important connection between creating a continuous flow of value and creating a working environment where individuals and teams can maximize their time in the zone. Knowledge workers also need the time and space free from interruption essential for complex tasks involving application, analysis, evaluation, and creativity, and ultimately the personal satisfaction that completion engenders.
#8 Remediate Legacy Policies and Practices
During or even after a Lean-Agile transformation, enterprises must constantly look out for legacy policies and practices that inhibit flow (see examples in Figure 9). Many of these practices became part of the culture and are described as “we’ve always done it this way,” even when they are no longer needed. Examples are many, some legendary:
- Continued reliance on phase-gate milestones and the iron triangle of fixed scope, variable resources, and time. In reality, all three components become fixed instead of trade-offs among constraints.
- Obsolete or unnecessary change control boards, including extraneous oversight and reporting
- Waterfall-based quality management systems for regulations and compliance
- Obsolete tech standards—design specifications, audit practices, and the like—in environments where they are not mandated or required for quality
- Continuation of timesheet reporting in addition to Agile Lifecycle Management (ALM) tooling, requiring double recording of time
- Traditional HR performance reviews and compensation policies cause unhealthy internal competition and conflicting personal priorities
- Agile is adopted only by teams; the mindset of management and portfolio governance remain unchanged

And that’s not an exhaustive list. While many of these patterns may well have solved problems in the past, they now create new problems that become ongoing impediments to flow. They must be proactively or reactively discovered, eliminated, modified, or mitigated.
Measuring Flow
It’s difficult to improve what isn’t measured. And historically, it has been challenging to measure the development process as the work items are mostly intangible and invisible, living mainly in the minds of the knowledge workers who design and build the systems. But the physics and tooling of flow (timeboxes, Kanban, value stream mapping, CD pipeline, stories, features, and more) provide a new basis for measuring the flow of value through the development value stream. The SAFe Metrics article describes six metrics —flow distribution, velocity, time, load, efficiency, and predictability—for measuring flow (see Figure 10).

- Flow Distribution measures the number of work items by type in a specific value stream. It helps maintain a healthy balance of new features with reduced tech debt, maintenance, and other technical work.
- Flow Velocity measures the average number of completed work items (stories, features, capabilities, epics), which measures a team’s capacity to deliver value and helps forecast future delivery.
- Flow Time measures how long it takes for a work item to go through the system. It helps teams predict when new value will become available and helps identify delays in the process.
- Flow Load measures the overall amount of work-in-process in the system. It helps the team optimize throughput by limiting demand to capacity.
- Flow Efficiency measures how much of the total flow time is spent in value-added work activities vs. waiting between steps. It helps identify bottlenecks, handoffs, and dependencies.
- Flow Predictability summarizes the team’s ability to achieve PI objectives. If predictability is low, it’s a sign that risks or impediments must be addressed.
Together, these metrics provide a comprehensive view as new value flows through the development value stream. These measures must be relatively easy to collect, maintain, and visible to be valuable and actionable. Fortunately, they can be automated using most modern Agile Lifecycle Management (ALM) tooling. In addition, organizations should complement the flow metrics with qualitative data to ensure their delivery flow creates the right solutions for customers when needed.
Summary
These eight flow accelerators help teams increase throughput and deliver value faster. As an added benefit, implementing them gives people a sense of control over the process and triggers fast and measurable improvements in customer satisfaction and employee engagement.
Learn More
[1] Womack, James P., and Jones, Daniel T. Lean Thinking: Banish Waste and Create Wealth in Your Organization. Free Press, 2003. [2] Reinertsen, Donald G. The Principles of Product Development Flow: Second Generation Lean Product Development. Celeritas, 2009. [3] Goldratt, Eliyahu M. The Goal: A Process of Ongoing Improvement. The North River Press Publishing Corporation, 1986 [4] Oosterwal, Dantar P. The Lean Machine. AMACOM, 2010 [5] Ward, Allen, and Durward Sobeck. Lean Product and Process Development. Lean Enterprise Institute, 2014. [6] Csikszentmihalyi, Mihaly. Flow. HarperCollins, 1990 [7] Kersten, Mik. Project to Product: How to Survive and Thrive in the Age of Digital Disruption with the Flow Framework. IT Revolution Press, 2018.
Last update: 11 August 2022